By Antonio Mallarino, Professor of Soil Fertility and Nutrient Management, Extension Specialist
Bumper grain yields are being harvested from most Iowa fields this fall. However, due to low crop prices producers are thinking of reducing phosphorus (P) and potassium (K) fertilizer application rates. A few important management options should be considered when making decisions with unfavorable crop/fertilizer price ratios.
1. Use soil sampling and testing to make rational decisions.
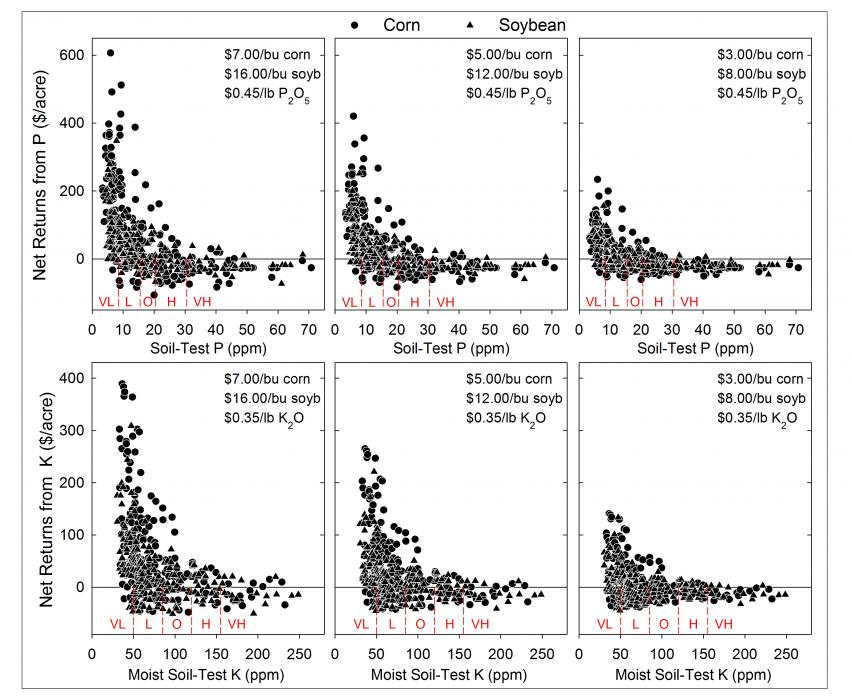
Soil testing is not a perfect diagnostic tool, but it is very useful. Its use is even more relevant with unfavorable crop prices. Iowa field research results have been used to develop soil sampling guidelines in extension publication PM-287 (Take a Good Sample to Help Make Good Decisions) and P and K soil-test interpretations in publication PM 1688 (A General Guide for Crop Nutrient and Limestone Recommendations in Iowa). Crop yield increases from fertilization are large and very likely in soils testing very low and low, but the size and likelihood of the response sharply decreases as soil-test values increase into the optimum category. Figure 1 shows very large and likely economic benefits from fertilization of corn and soybean in soils testing very low, but benefits bounce around break even in the optimum category (due to small or no yield increase), and become mostly negative in high-testing soils.
Therefore, producers should not reduce P or K application in soils testing very low, may slightly reduce the rate in soils testing low and optimum, and only a low starter rate might be justified in high-testing soils. Publication PM 1688 indicates recommended rates for low-testing soils.
Only removal-based rates are recommended for the optimum category to maintain soil test levels over time. For corn and soybean, the optimum category is 16-20 ppm P for the Bray-1 and colorimetric Mehlich-3 methods, 26-35 ppm for the Mehlich-ICP method, and 10-13 ppm for the Olsen method. The optimum category for K by both the ammonium-acetate and Mehlich-3 methods is 161-200 ppm for testing laboratory dried soil samples and 86-120 for the field-moist or slurry laboratory sample processing and extraction.
 Figure 1. Net returns to phosphorus (P) or potassium (K) fertilization for different soil-test levels (Bray-1 P and moist ammonium-acetate K) in many Iowa soils for shown prices (interpretation categories very low to very high are indicated.
2. Watch yield level and P and K removal to maintain optimum values.
The yield level and P or K removal should be used to determine the application rate needed to maintain soil-test levels in the optimum category. Publication PM 1688 includes suggested average P and K concentrations in common harvested crop parts. As economic returns in Fig. 1 show, there is high response variation within the optimum category for various reasons.
A removal-based rate will maximize yield, but often the small yield increase does not offset application costs, especially with current low prices. Therefore, if the grower’s economic condition is particularly bad or there is uncertain land tenure, a fraction of the estimated removal-based rate or only starter could be applied when prices are low. This may increase profits in the short-term, but higher nutrient rates will be needed in the future because soil-test values will decline.
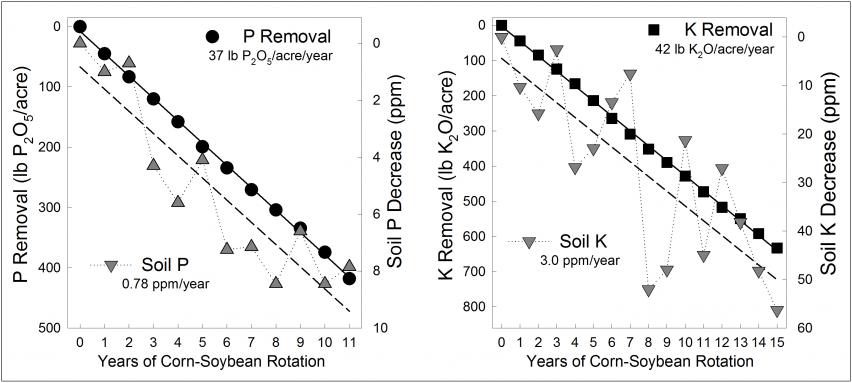
The decline in soil-test values is much slower than many believe, and growers having high-testing fields or field areas could save money by withholding or reducing application rates until levels decrease to the optimum category. They should be aware that there is a good long-term relationship between P and K removal with harvest and soil-test values, but not necessarily consistent from year to year, especially for K.
Figure 2 shows average results across five long-term experiments in a corn-soybean rotation. Results from these and other long-term experiments show that, on average, and depending on the yield level, about 10 years are needed for soil-test P or K values borderline between the high and very high categories to decrease to the optimum level, where maintenance based on removal is recommended.
 Figure 2. Relationship between cumulative phosphorus (P) and potassium (K) removal with grain harvest and soil-test values over time for plots not fertilized with P or K (Bray-1 for P and ammonium-acetate for K from dried soil samples).
3. Use a good soil sampling method and variable-rate technology application.
Use of variable-rate P and K fertilization is a good option to improve P and K management in fields that have significant variation in soil-test or yield levels. This technology can be used to target application to the most deficient field areas to get the highest possible return when price ratios are unfavorable and also to improve maintenance fertilization by considering yield variability.
Research suggests that either grid sampling or zone sampling methods are superior to the common sampling by soil type (see publication PM 287). However, grid soil sampling often is much better than zone sampling, and allows for easier and safer decisions because the many samples allow one to see when large portions of a field or an entire field consistently test Low or High. Also, the impact of sampling or testing errors is diminished when several samples are taken. Yield maps from the past 2-4 years (not just the last one) should be used together with soil-test values to help define P and K application rates.
4. Do not reduce the recommended P and K rate for low-testing soils by banding.
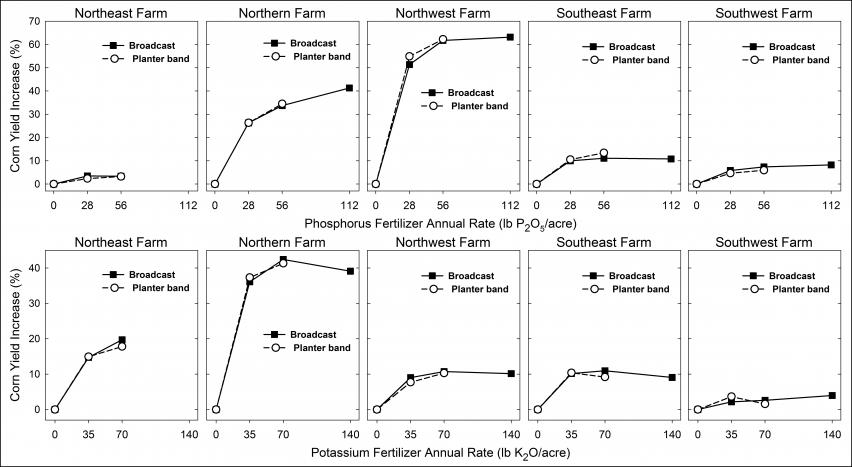
Research conducted in many Iowa fields during several decades has shown that banding P and K fertilizer seldom is more efficient than broadcasting, even with no-till or strip-till management. Therefore, reducing the fertilizer rate for low-testing soils when banding will increase the risk of yield loss, may reduce profits from crop production, and future fertilization rates will need to be increased. Recent research has confirmed these results.
Figure 3 shows typical results for no-till corn yield response to broadcast or planter-band P or K, and similar results have been observed with tillage and for soybean. Deep placement of K fertilizer (about 5-6 inches deep) for corn often is beneficial in ridge-till and sometimes in no-till or strip-till (not shown), but reducing the application rate is not recommended. In some conditions, starter P applied to the corn seed furrow or beside the seed can complement a primary broadcast application. This happens mainly when applying the P rate for one crop year in soils testing very low, and/or with a thick residue cover and cool or wet spring weather, or the broadcast rate is much less than recommended for the test category.
For additional information visit the Iowa State University Soil Fertility web site at www.agronext.iastate.edu/soilfertility.
 Figure 3. No-till corn grain yield response to phosphorus or potassium fertilizer broadcast or banded with the planter in five Iowa fields with varying soil types and soil-test values.
Related articles:
Research Shows a Role for Phosphorus and Potassium Tissue Testing in Corn
Value of Soybean Tissue Testing for Phosphorus and Potassium


