By George Silva, Senior Educator
The end-of-season cornstalk nitrate test provides a reliable overall assessment of nitrogen (N) management practices under normal growing conditions.
According to this test, the stalk nitrate N concentrations are divided into three broad categories: low (less than 700 ppm), optimal (700-2,000 ppm) and excess (greater than 2,000 ppm).
The low range indicates an N shortage situation and is often associated with visual deficiency symptoms. (Some universities consider 450 ppm as the lower limit instead of 700 ppm.) The optimal range indicates N availability that corresponded to maximum economic returns. The excess range indicates N availability greater than required for maximum economic returns. Quite often the excess range is associated with overapplying N fertilizer or animal manures.
The methodology and interpretation of this test is discussed in some detail in the Michigan State University Extension article, “End of season corn stalk nitrate test.” Although the stalk nitrate N level is primarily influenced by the N rate, other factors such as drought, N leaching, pest damage and other stress situations may have substantial effects.
With severe drought conditions in late May, June and July, many mid-Michigan growers experienced reduced corn yields in 2016. Growers are wondering how much of their traditional N fertilizer practices were effective this year. There is speculation about the reliability of the stalk nitrate test considering the abnormal growing conditions.
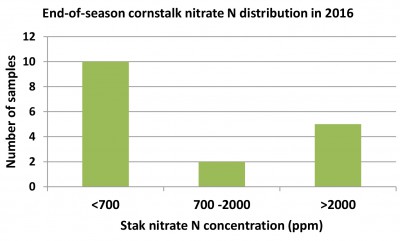
 The stalk nitrate N distribution of 17 samples submitted by growers from Ingham and Eaton counties in 2016 are shown in the graph. A majority of samples (10) were in the low category with less than 700 ppm. Two samples were in the optimal category and five samples were in the excess category. These fields received the grower’s standard N practice of synthetic N fertilizer rates ranging from 110-220 pounds N per acre. Two fields in the excess category had also received substantial quantities of dairy manure in the previous years.
The average stalk nitrate N concentration in 2016 was 1,240 ppm. In previous years, the overall nitrate N averages were 2,472 in 2012, 1,350 in 2011 and 1,872 in 1999. The driest year in the past 10 years was 2012, where it stayed consistently dry throughout the growing season. In 2016, however, the period from late May to end of July was even drier than 2012. The critical month of June received only 0.9 inches of rain compared to 3.6 inches in 2012.
With so little moisture in the soil, it is conceivable that roots were not capable of taking up most of the N that was traditionally applied at the V6 stage. This scenario most likely contributed to the below average stalk nitrate N levels in 2016 compared to all previous years.
The August, September and October rainfall, however, turned out to be much above normal, making 2016 almost a “wet” year in terms of total rainfall. So, the popular belief that stalk nitrate N tends to be higher in drier years may still hold true as seen in 2012, but the stalk concentration may also depend on when and how the drought impacted the N uptake at the critical early growth stages.
The stalk nitrate N test does not provide any remedy or relief for the current year, but familiarity with the data over a number of years, including drought years, should assist producers in fine-tuning their N fertilizer practices to suit seasonal changes in weather. Please refer to MSU Extension Bulletin E2904, “Nutrient Recommendations for Field Crops in Michigan,” for the latest corn N recommendations.


